Imaging

To study the properties of PP1 complexes in living cells, we routinely take advantage of the in vivo approach of fusing the catalytic and regulatory subunits to genetically encoded fluorescent reporter molecules like the green fluorescent protein (GFP) derived from the jellyfish Aequorea victoria and the red fluorescent protein (RFP) derived from the coral Discosoma. This “tags” the intracellular pool of the protein for both assessment analysis of its localization in fixed cells (using high or super-resolution imaging approaches) and analysis of its dynamic properties in living cells. See below for examples of the various techniques that we use.
Expansion microscopy-based super-resolution imaging
Expansion microscopy (ExM) is a sample preparation technique in which fixed and immunostained cells or tissues are embedded in a cross-linked network of swellable polyelectrolyte hydrogel that expands isotropically upon addition of deionized water.
We optimized the X10 method developed by the Rizzoli lab (EMBO Rep 2018) for tenfold expansion of U2OS cells with concurrent DNA staining. In collaboration with the Beique lab, we also generated a custom 3D-printed gel cutter sized for use with chambered slides to minimize gel drift during imaging.
ExM facilitates our analysis of cellular structures at nanoscale resolution by conventional microscopy. We also pair it with Airyscan-based confocal imaging and volume rendering techniques to visualize structural relationships between different components.


U2OS cells imaged pre- and post-expansion using a Zeiss AxioObserver D1 inverted epifluorescence microscopy with a 20x/0.8 NA objective (nuclei in blue, nucleoli in red and cytoplasmic stress granules in green).

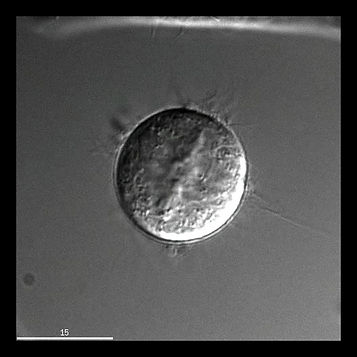
Expanded gel in 10 cm dish (original 18x18 mm coverslip that cells were seeded on pre-expansion shown on top for comparison)

Expanded cells imaged using the Airyscan mode on a Zeiss LSM880 laser scanning confocal microscope, followed by Imaris-based surface rendering to visualize details of a nuclear structure with nanoscale resolution.
Live cell time-lapse imaging
For imaging live cells in glass bottom dishes or chamber slides, replace the standard growth medium with Phenol Red-free medium. A heated environmental chamber supplied with 5% CO2 should maintain pH, but 20 mM HEPES can be added to the medium as a backup buffer. Drug treatments can be added and washed out during imaging, as required.
Cell cycle progression can be monitored by Phase Contrast or DIC imaging but greater accuracy is obtained when chromosomes are marked with a fluorescent dye (e.g. Hoechst 33342) or expression of a fluorophore-tagged histone or chromatin-targeted nanobody (see movies below). Prophase cells can be found by their characteristic condensed DNA pattern, and then followed through mitosis (minimizing the amount of light the cells are subjected to by keeping exposure times as low as possible while maintaining adequate resolution).
PCNA is commonly used as a marker for G1 / S / G2 progression. For live imaging, cells stably expressing a fluorophore-tagged anti-PCNA nanobody are a good option.


DIC imaging of a HeLa cell undergoing mitosis (starts in metaphase).
Fluorescence imaging of a HeLa cell stably expressing GFP-tagged histone H2B undergoing mitosis (starts in prophase).
Generating cell lines that stably express fluorophore-tagged proteins
Random Integration of Expression Plasmids
Bacterial Artificial Chromosome
CRISPR/Cas9 Gene Editing


Tagged protein is over expressed against a background of the endogenous protein. This overexpression should be minimized, and cell lines validated to ensure that the tagged protein is a reliable marker for the endogenous pools of protein.
Random integration of BACs, which include upstream and downstream regulatory elements, minimize overexpression of the tagged protein at the approximate level of the endogenous protein.
CRISPR/Cas9-based knocking of a fluorophore tag at the 5' or 3' end of the endogenous gene allows for direct observation of the endogenous protein.
FRAP analysis provides information about underlying binding events

A combination of FRAP analysis and measurement of nuclear retention following light permeabilization allowed us to rapidly identify the C-terminus of RepoMan as the region that governs association with chromatin.

In vivo assays to monitor protein-protein interactions
BiFC: In this technique the 2 proteins to be assessed are expressed as fusions to N- and C-terminal fragments of a fluorophore (e.g. YFP). Interaction of the 2 proteins brings the halves together and the fluorophore re-forms and can be excited to emit light.


FRET: In this technique the 2 proteins to be assessed are expressed as fusions to a donor and an acceptor fluorophore with sufficiently overlapping spectral profiles. If the 2 proteins are in close proximity (< 10 nm), the excitation of the donor leads to transfer of some of its energy to the acceptor, which will in turn emit light. This "sensitized emission" can be monitored directly, or FLIM (Fluorescence Lifetime Imaging) can be used to monitor quenching of the donor.

In the example shown here, the bait is mCherry-tagged PP1, and it accumulates in a discrete spot in the nucleus. A known GFP-interactor (e.g. targeting subunit) accumulates at this spot due to association with PP1. This approach is a quick way to confirm interaction with PP1, and to then test the effect of mutating suspected PP1 binding sites on this interaction.
F2H: In this technique a fluorophore- and LacR-tagged bait protein is anchored to an engineered gene locus by association with LacO repeat regions. This forms a discrete spot. Prey proteins tagged with a different fluorophore are then expressed in the cell. Accumulation/colocalization with the bait protein at the gene locus confirms their interaction (although it is not necessarily direct).

Microscopy Courses at uOttawa
uOttawa undergraduate students in the Translational & Molecular Medicine (TMM) program can learn more about imaging by registering for the 4th year course TMM4911: Advanced Methods in Cell Biology and Microscopy. A combination of lecture-based learning with highly interactive hands-on workshops is used to first introduce the principles behind a range of imaging-based assays and then provide the opportunity for students to carry them out. Active learning sessions, in collaboration with the Cell Biology & Image Acquisition core facility, will address the analysis, interpretation and critiquing of imaging data.
uOttawa graduate students can learn more about modern methods in optical microscopy by registering for CMM5360: Imaging in Cell Biology. This course touches on all aspects of biological imaging, providing a systematic and in-depth examination of the theory of image formation and the application of diverse imaging techniques to explore biological questions at the level of the single cell. In particular, the course will emphasize the importance of proper sample preparation and highlight quantitative issues that are critical to the proper interpretation of images obtained with modern microscope systems. Students will also learn how to critically read primary literature based on imaging approaches.